Inputs
- ERA5 atmospheric fields
- ECMWF forecasts and ensembles
- MRMS radar products
- NOAA Storm Events reports
Open foundation models for severe convective storm science.
OpenSCS is an open scientific AI initiative for modeling severe convective storms, including hail, thunderstorm winds, and tornadoes. The project combines atmospheric reanalysis, radar-derived products, forecast data, and storm reports to build reusable datasets, model weights, hindcast pipelines, benchmarks, and evaluation tools.
Early research prototype. Not intended for operational warnings.
The strongest current evidence is spatial: the models recover broad severe-weather corridors and high-risk regions seen in observed/report-based climatology.
Current stage: proof of concept. The models shown below are early research outputs evaluated on a held-out test period. They are intended for scientific research and benchmarking, not for issuing warnings.
OpenSCS connects atmospheric data, radar products, storm reports, model training, hindcast generation, and evaluation into a reproducible severe-weather AI workflow.
Severe-weather AI needs reproducible workflows, shared benchmarks, transparent evaluation, and clear documentation.
Severe convective storms cause major societal and economic impacts, but severe-weather AI research is often fragmented across separate datasets, labeling methods, model code, evaluation scripts, and visualization tools. This makes it hard to compare models, reproduce results, and build shared benchmarks.
OpenSCS aims to make severe-weather AI more reproducible by developing open workflows for data preparation, label generation, model training, hindcast generation, evaluation, and documentation. The long-term goal is to support open scientific benchmarking for severe convective storm hazards.
We evaluated prototype models for hail, thunderstorm wind, and tornado. The strongest early evidence is spatial: the models recover broad severe-weather corridors and high-risk regions seen in observed/report-based climatology. These results are preliminary and are intended to guide continued model development, calibration, and open benchmarking.
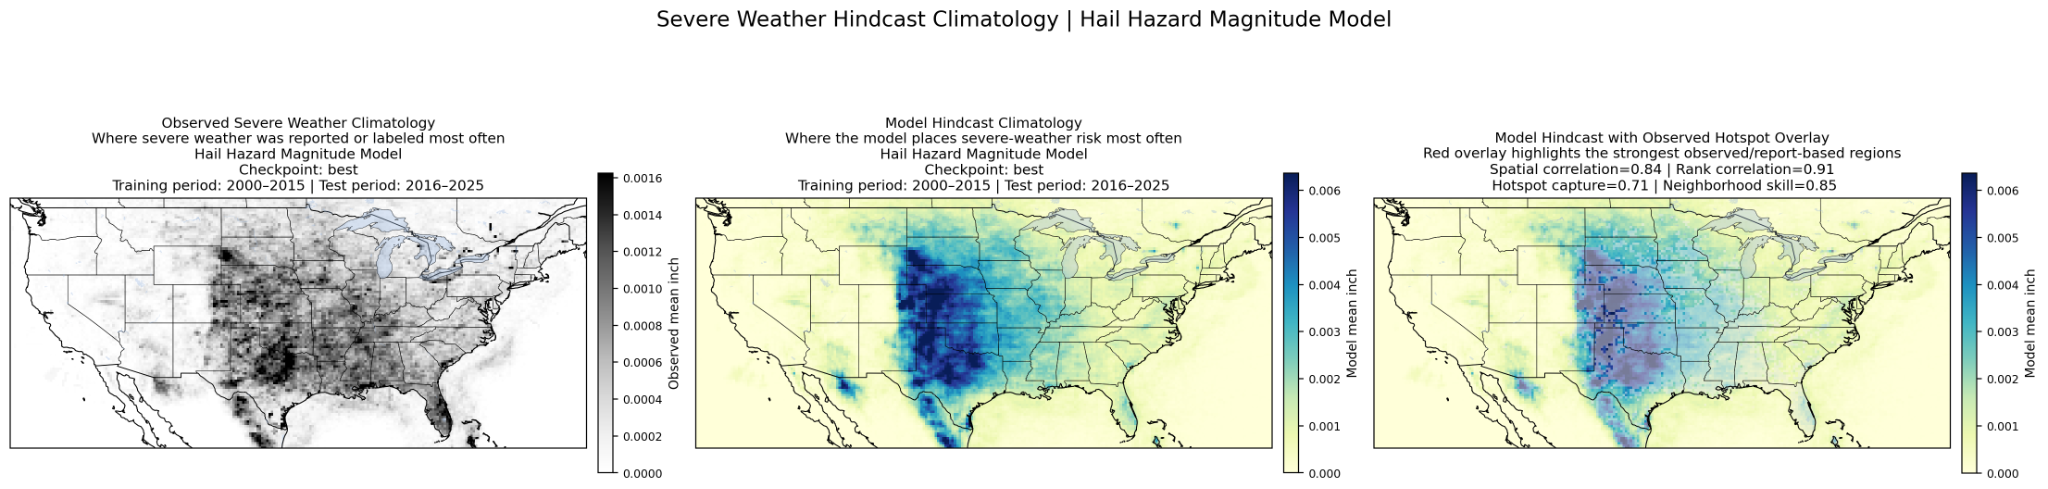
The hail model captures the main severe-hail corridor and reproduces many of the same high-risk regions seen in observed/report-based climatology. After filtering out sub-severe hail below 0.5 inch, the selected model shows strong spatial agreement, strong regional ranking skill, and low event-cell error among the evaluated hail checkpoints.
Figure summary Observed hail climatology, model hindcast climatology, and model output with observed hotspot overlay. The model captures the broad severe-hail corridor and many of the strongest hail-risk regions.
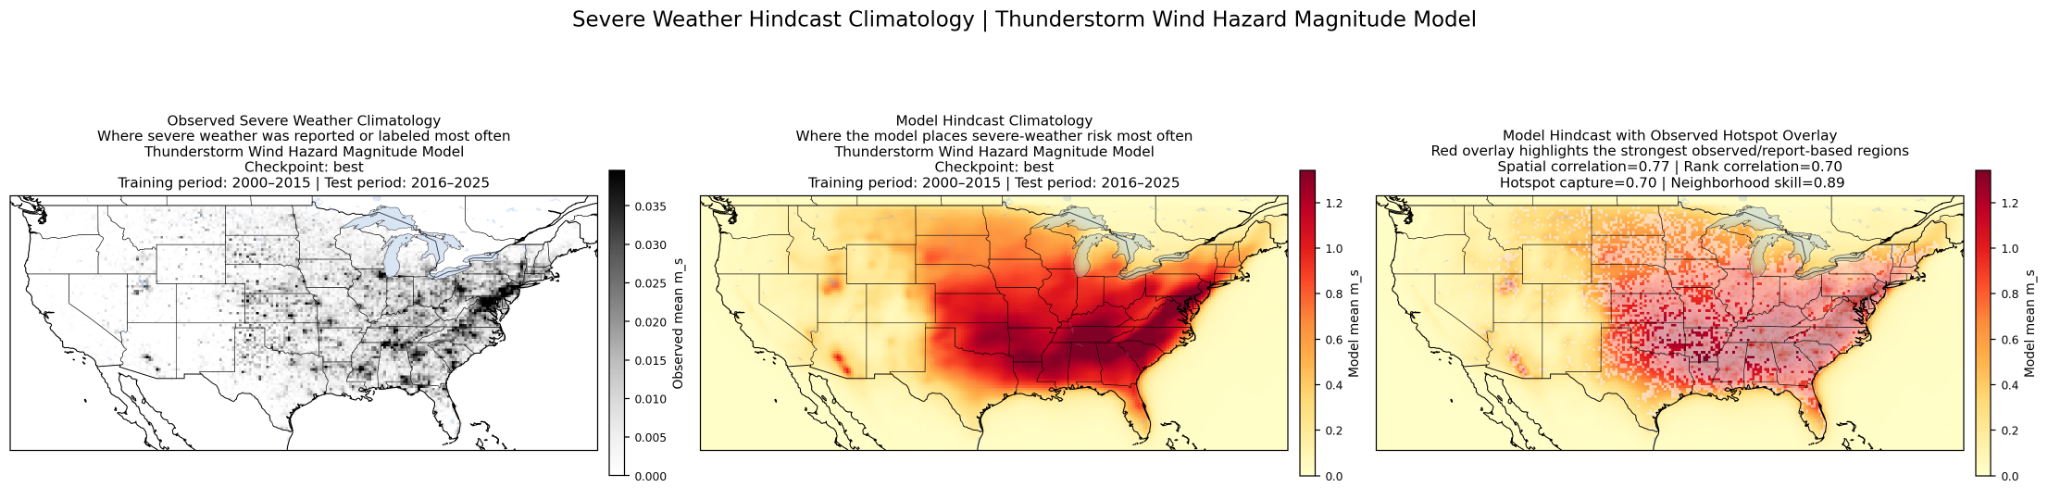
The thunderstorm-wind model learns coherent regional wind-risk structure and captures many of the same high-risk areas found in observed/report-based climatology. The strongest result is spatial: the model recovers broad geographic risk patterns and high-risk wind corridors across the test period.
Figure summary Observed thunderstorm-wind climatology, model hindcast climatology, and model output with observed hotspot overlay. The model shows strong neighborhood agreement for high-risk wind regions.
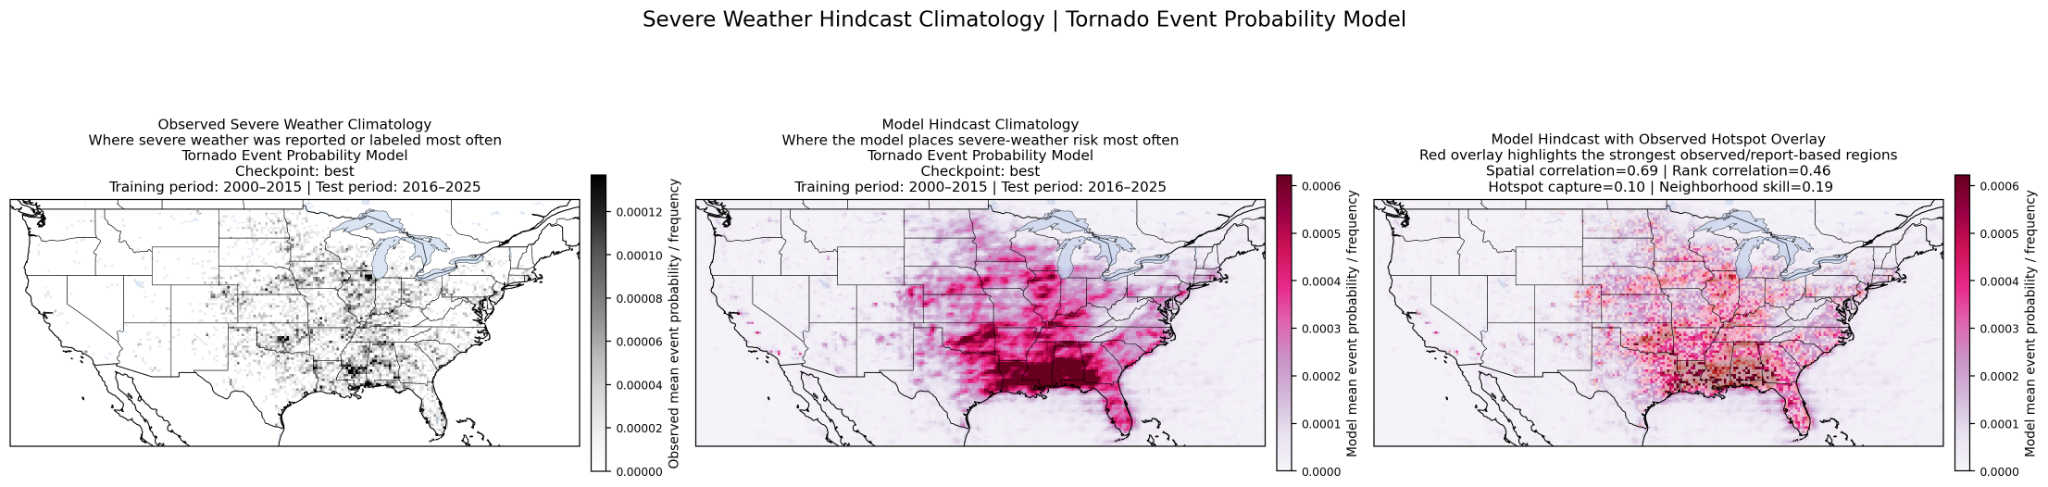
Tornado prediction is the most challenging task because tornadoes are rare, localized events. Instead of treating this as a simple accuracy problem, we evaluate it as a rare-event probability task. The selected tornado model learns a meaningful broad spatial signal and shows the strongest probability skill among the evaluated tornado checkpoints, while calibration and false-alarm reduction remain active areas of development.
Figure summary Observed tornado climatology, model probability climatology, and model output with observed hotspot overlay. Tornadoes are rare and highly localized, so this prototype emphasizes broad probability signal and rare-event ranking skill.
These explanations are written for non-technical readers. Higher is better for agreement, ranking, hotspot capture, and AUPRC. Lower is better for error and Brier scores.
Measures whether the model’s geographic risk map matches the observed/report-based map. A high value means the model is learning the right broad severe-weather regions.
Measures whether the model ranks places correctly from lower risk to higher risk. This helps when exact magnitudes are imperfect but the model still identifies the right high-risk areas.
Looks at the strongest observed risk regions and asks how many of those hotspots are also captured by the model.
A spatially forgiving metric. It gives credit when the model places risk close to the observed region, even if it is not on the exact same grid cell.
For hail and wind, MAE is the average size or speed error where event activity exists. RMSE is similar, but penalizes larger errors more strongly.
Area Under the Precision–Recall Curve. This is useful for rare events like tornadoes because normal accuracy can be misleading when most grid cells are non-events.
A probability error score. Lower is better. It measures whether predicted probabilities match what actually happened.
A Brier score adjusted to give rare tornado events more weight instead of being dominated by the huge number of non-event grid cells.
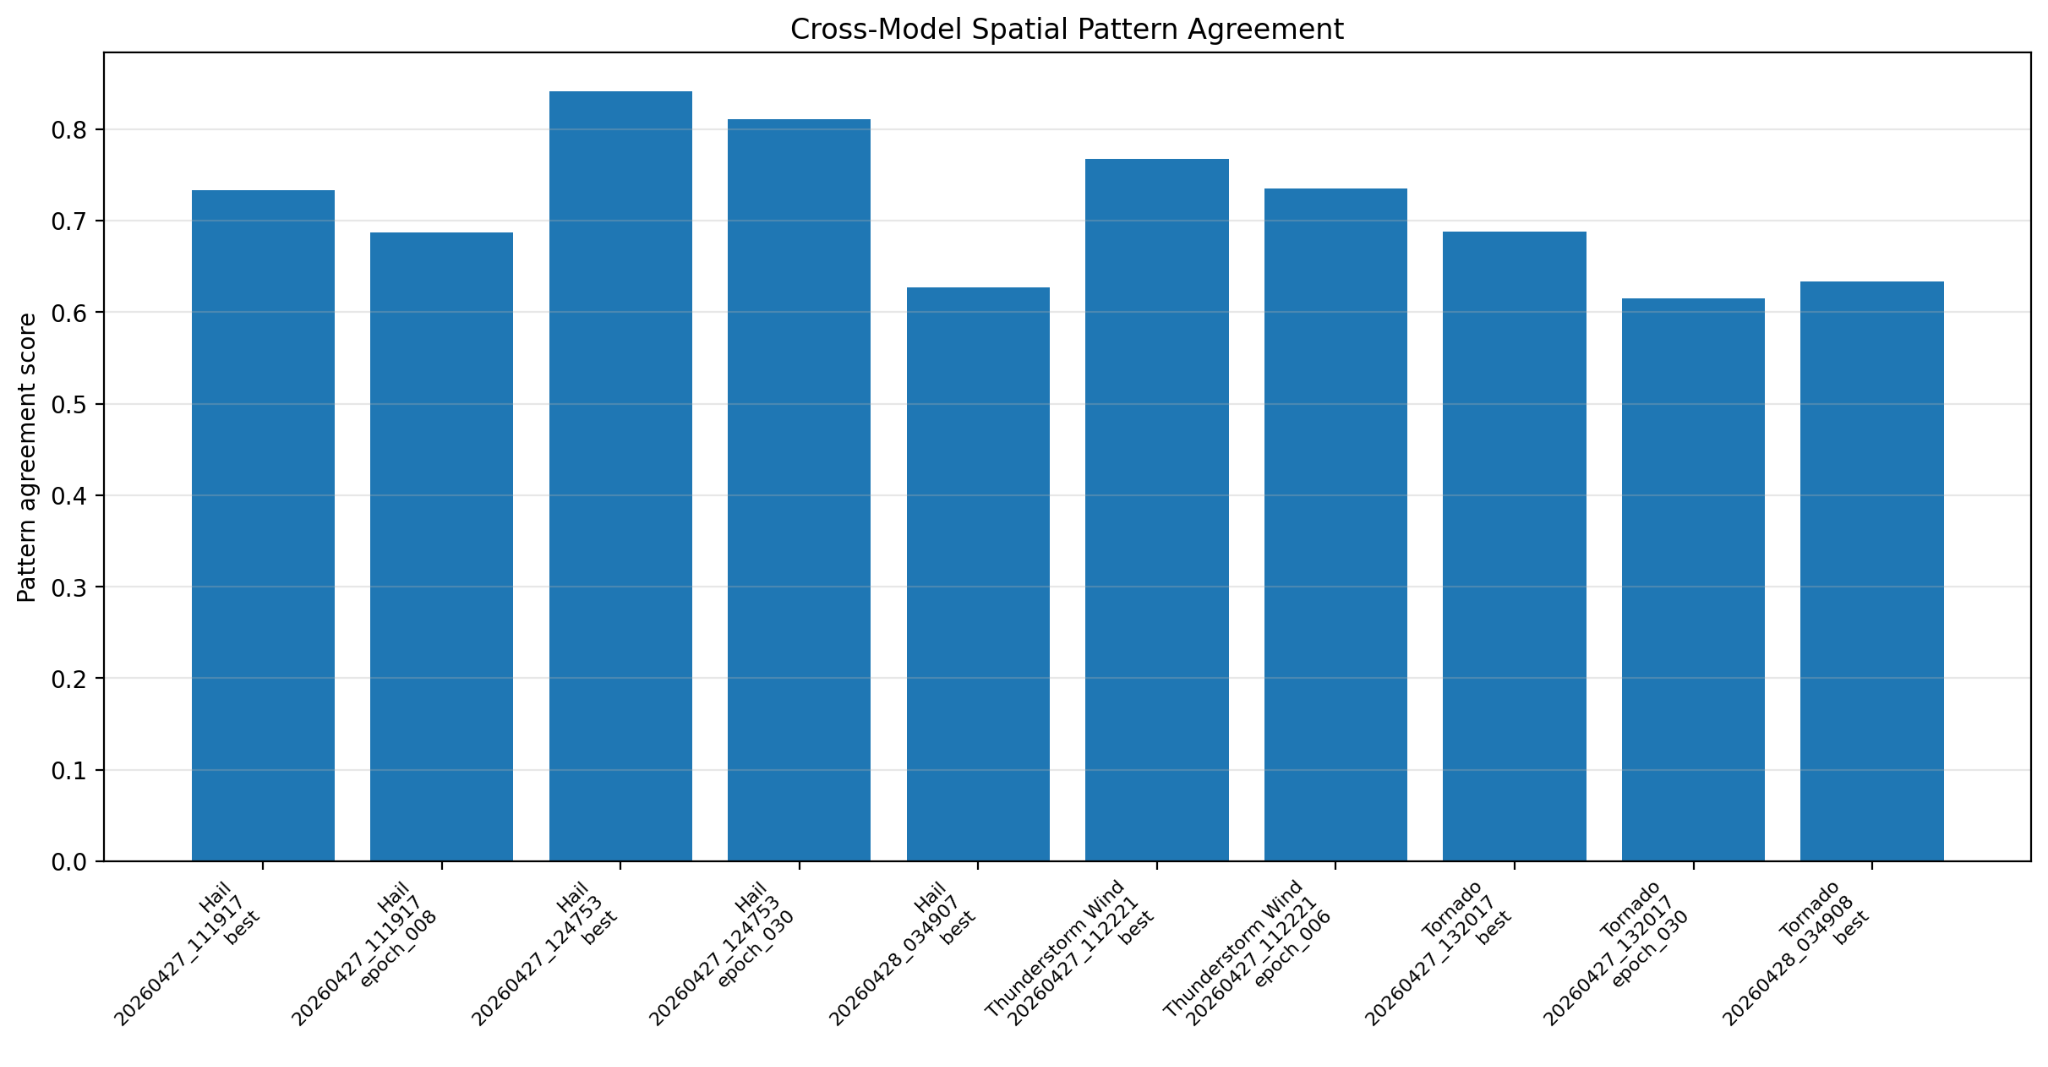
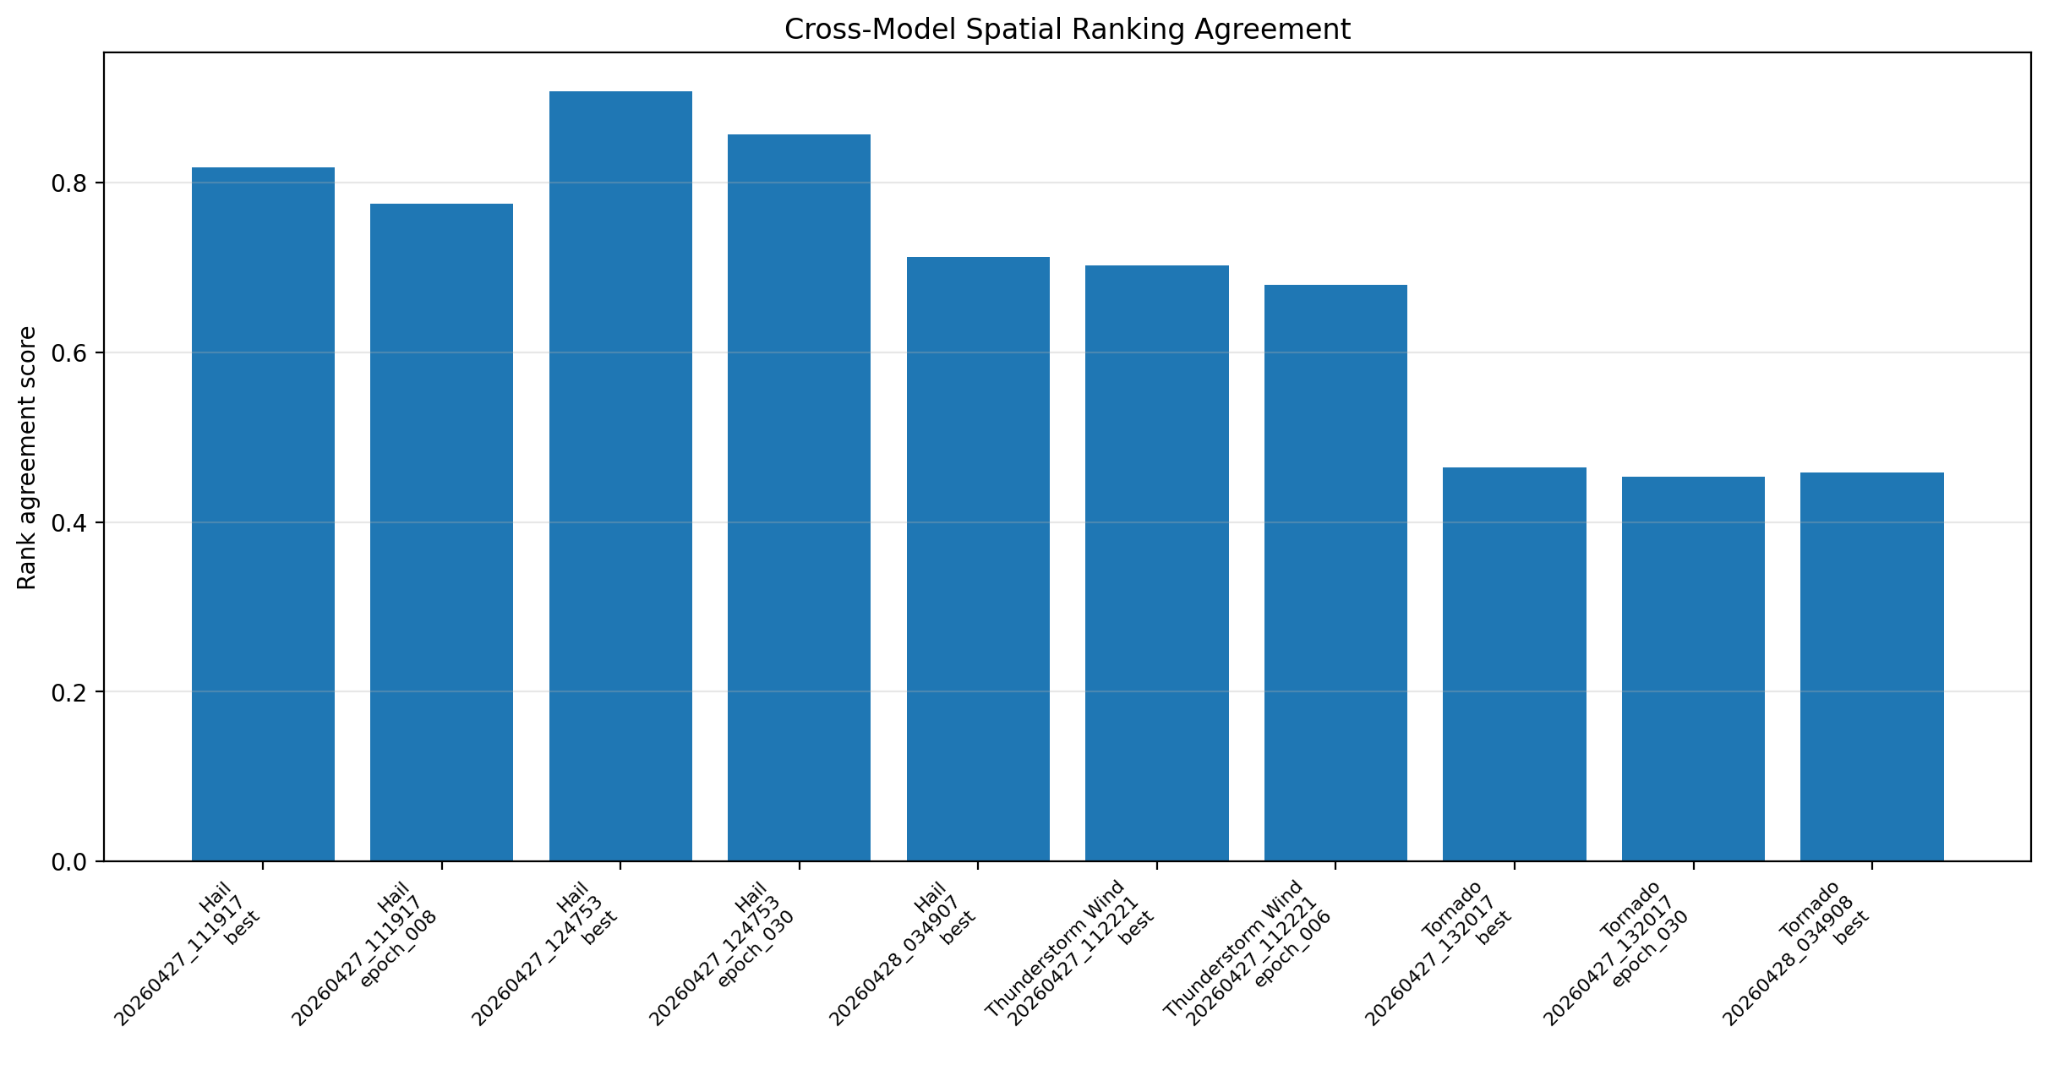
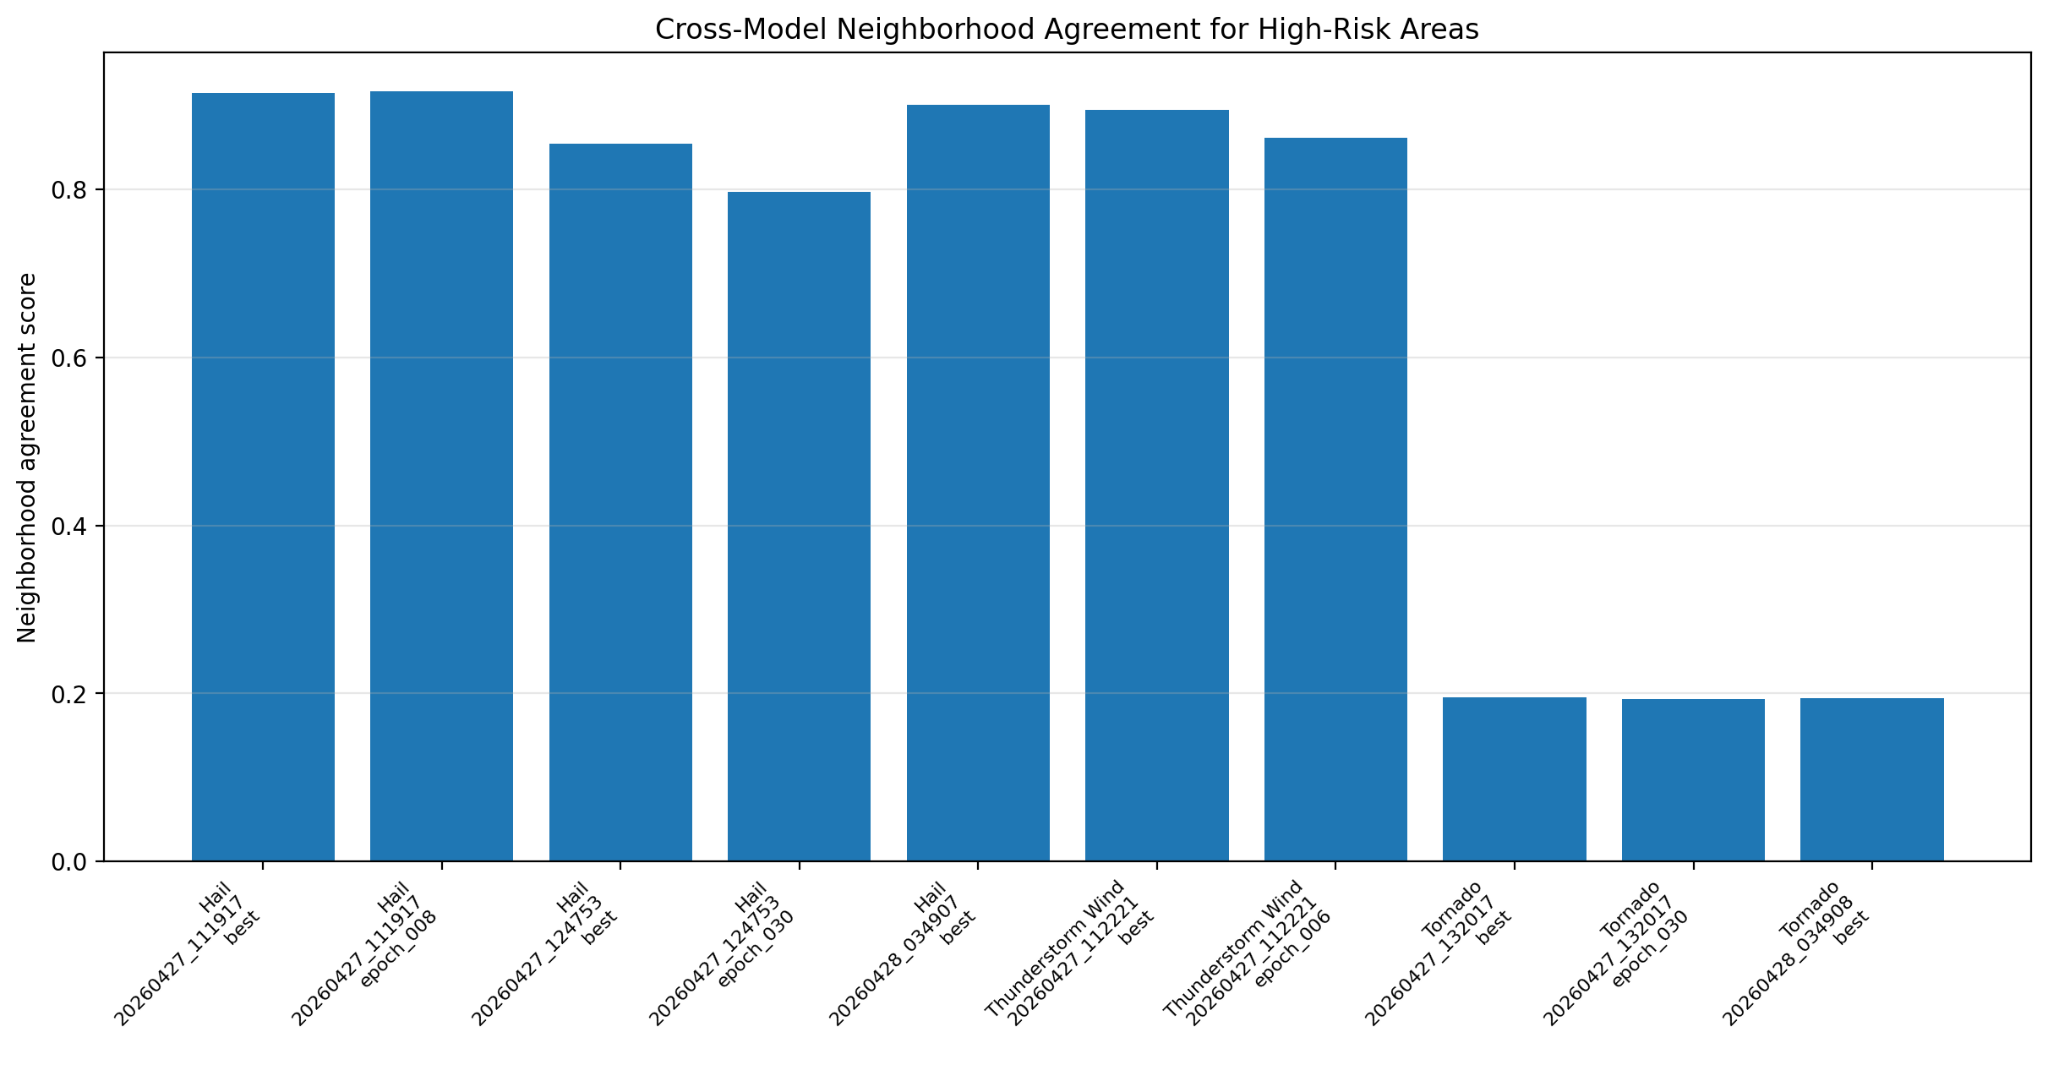
We evaluated multiple prototype checkpoints for each severe-weather peril. Across the evaluated candidates, the strongest and most consistent evidence is spatial. Hail and thunderstorm wind models recover broad risk corridors and high-risk regions, while tornado remains a rare-event probability task where calibration and false-alarm reduction are ongoing development priorities.
 Click to enlarge
Compares how well candidate models reproduce broad observed/report-based spatial patterns.
 Click to enlarge
Checks whether candidate models rank regions from lower to higher risk in a similar way to the observed/reference maps.
 Click to enlarge
Gives spatial credit when predicted high-risk areas are close to observed/report-based high-risk areas.
OpenSCS is designed as a reproducible severe-weather AI workflow, from raw atmospheric and storm-report data through training, hindcast generation, and evaluation.
ERA5, ECMWF, MRMS, and NOAA Storm Events are aligned into geospatial tensors for severe-weather modeling.
Hail, tornado, and thunderstorm-wind labels are generated with metadata for uncertainty, event thresholds, and reporting bias.
Prototype spatial models are trained using balanced sampling and distributed GPU workflows to improve learning from rare severe-weather examples.
Hindcasts, climatology maps, spatial metrics, calibration diagnostics, and benchmark dashboards are used for model comparison.
OpenSCS work includes ERA5 atmospheric variables, MRMS radar-derived products, NOAA Storm Events labels, hindcast generation, spatial climatology evaluation, and reliability diagnostics. Deeper implementation notes will be documented in model cards, data cards, and reproducibility guides.
The current models are proof-of-concept prototypes. The next phase will focus on forecast-data integration, foundation-model training, open benchmark releases, calibration, uncertainty communication, and reproducible evaluation dashboards.
The next phase keeps the work research-first: stronger data integration, better calibration, clearer documentation, and practical evaluation tools that other teams can inspect and reuse.
Add forecast and ensemble data streams for future foundation-model experiments.
Train broader severe-weather models across multiple data sources and hazards.
Publish clear splits, metrics, plots, and scripts for reproducible comparisons.
Document intended use, caveats, uncertainty, reporting bias, and limitations.
Build practical tools for maps, metrics, calibration, and model comparison.
Improve false-alarm reduction, probability calibration, and validation across years, regions, and event types.
OpenSCS is intended for scientific research, benchmarking, education, and climate-risk analysis. It should not replace official forecasts, watches, warnings, or emergency guidance.
Public releases will include model cards, data cards, uncertainty diagnostics, calibration results, known limitations, and responsible-use guidance.
OpenSCS is being developed as an open-science effort. We welcome collaboration around datasets, benchmarks, evaluation methods, model cards, documentation, and responsible deployment practices.